2021: When Private Equity’s Capital and Valuations Peaked Together
2021 put more buyout capital to work at higher entry multiples than any other vintage, exposing LPs to concentration that vintage labels conceal.

Every institutional playbook says the same thing about private equity: pace your commitments consistently across vintage years. Commit a steady amount every year, the logic goes, and you average into the market, buying some vintages cheap and some dear, smoothing your entry price across cycles. It is the private-markets version of dollar-cost averaging, and it is treated as settled discipline.
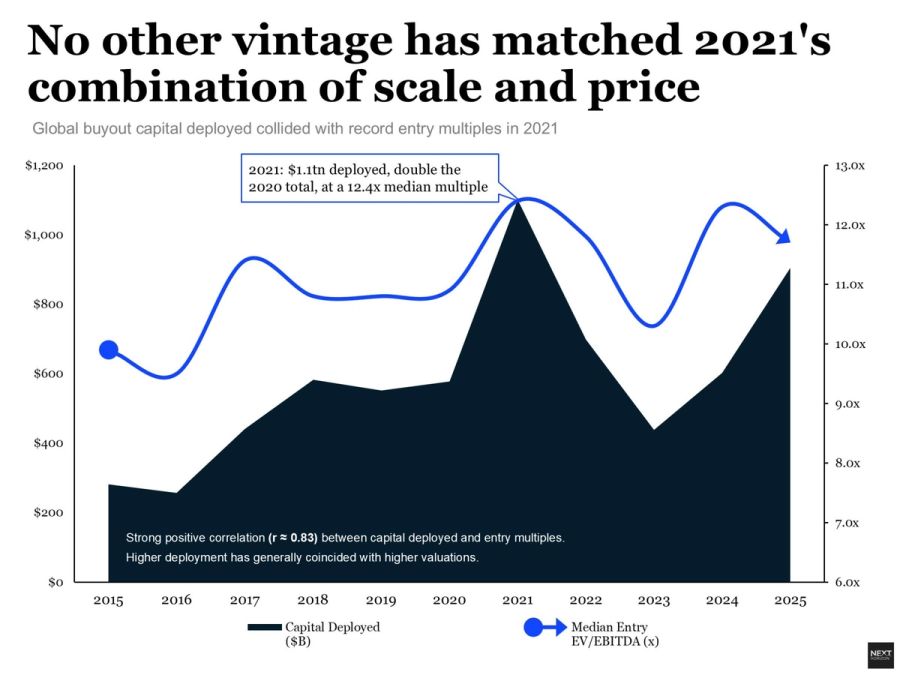
The data says the discipline was not followed, and that even where it was, it did not deliver what LPs think it delivered.
Start with what actually peaked. Buyout fundraising did not peak in 2021. Bain records $387 billion raised that year, the second-best on record, and buyout funds raised more in 2023. So a chart titled "capital raised by vintage" does not support the concentration argument. What peaked, and by a wide margin, was capital deployed. Bain reports buyout deal value hit $1.1 trillion in 2021, "doubling 2020's total of $577 billion and shattering the previous record of $804 billion set in 2006." Deployment, not fundraising, is where the exposure lives, because deployed capital is the capital actually exposed to that year's entry price.
Now overlay price. Global buyout median entry multiples reached 12.4x in 2021, against a 2015-2020 average of about 10.55x. In the US the peak was sharper, near 14x. So 2021 is the one year in the series where the most capital in history entered at close to the highest prices in history. No other year did both. That is the real finding, and it is more precise than the headline: 2021 was not simply expensive, it was expensive at scale.
Two honest corrections keep this defensible. First, multiples did not stay uniquely high in 2021. They recovered. Global multiples reached 12.3x in 2024, and US buyout medians matched the 2021 record at 12.5x in 2025. As PitchBook's Garrett Hinds put it, "In 2021, buyers paid up because money was nearly free. In 2025, they paid up despite rates that were far higher, and they funded the difference with equity rather than debt." Second, the effect on a blended portfolio's entry price is modest in aggregate: capital-weighting the multiple across 2019-2025 lifts it only about 0.16 turns above the simple average. The concentration bites hardest not on the index but on the individual LP that leaned in.
And some did lean in, hard. CalPERS committed roughly $2.7 billion a year to private equity on average from 2009 to 2018, then $19.5 billion to the 2021 vintage alone. Its own investment team now calls 2021 a "challenged vintage" and describes the prior pattern as procyclical. That is the opposite of consistent pacing. It is buying the most when prices are highest, which is precisely how vintage diversification quietly becomes vintage concentration.
The performance data is already scoring the bet. PitchBook's pooled DPI by vintage falls in a straight line: 1.37x for 2015, down to 0.25x for 2020 and just 0.13x for 2021. The 2021 vintage's median net IRR is about 10.7%, versus 15-18% for 2015-2019, and it is trailing the S&P 500 on a public-market-equivalent basis. The most-capitalized, highest-priced vintage is the slowest to return cash.
The forward problem is arithmetic. Bain's "12 is the new 5" captures it: a deal that needed 5% annual EBITDA growth to reach 2.5x in the leverage-and-multiple-expansion era now needs 10-12%. A dollar deployed at 14x buys less earnings than a dollar deployed at 10x, and it must exit into a market that may clear lower. Peak-priced vintages carry the heaviest operational burden precisely because financial engineering can no longer carry them.
For LP underwriting, the question is not how many vintages you own. It is how many dollars you deployed in 2021, at what multiple, and how much EBITDA growth those assets now require to clear. Count dollars and turns, not vintage labels.